Online Retail, Kaggle
2025. 11. 26. 16:51ㆍAI활용 멀티모달&MCP 과정
캐글 실습 완전 정복! Online Retail 데이터로 매출 분석하기 📊

1. 캐글(Kaggle)이란?
안녕하세요~ 오늘은 데이터 분석 입문자라면 꼭 알아야 하는 캐글과 함께
실전 데이터로 매출 분석을 차근차근 해볼게요! 😊
캐글은 세계에서 가장 큰 데이터 과학 커뮤니티예요. 무료로 수만 개의 실제 데이터셋을 주고,
다른 사람들의 코드를 보면서 배우기 딱 좋은 곳이랍니다~
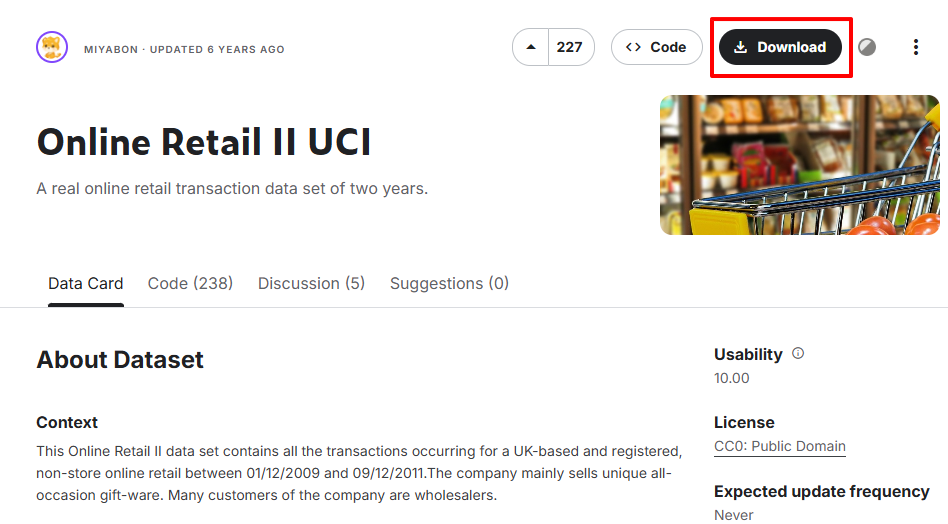
2. 캐글 데이터셋 다운로드 2가지 방법
방법 1: 그냥 Download 버튼 눌러서 zip 받고 코랩에 드래그 → 제일 쉬움!
방법 2: Kaggle API 쓰는 방법 → 한 번 설정해두면 계속 편함!
방법 2: Kaggle API 쓰는 방법 → 한 번 설정해두면 계속 편함!
# API 방법 (코랩에서)
from google.colab import files
files.upload()  # kaggle.json 업로드

!mkdir -p ~/.kaggle
!cp kaggle.json ~/.kaggle/
!chmod 600 ~/.kaggle/kaggle.json

# 예시 다운로드 명령어(캐글사이트 CLI클릭시 나오는 명령어)
!kaggle datasets download -d mcdonalds/nutrition-facts
3. Online Retail 데이터 불러오기 & 탐색
import pandas as pd
retail = pd.read_excel('online_retail.xls')

retail.info()
retail.describe()
retail.head()
4. 데이터 전처리 (결측치·이상치 제거)
# 고객 ID 없는 행 제거
retail = retail[pd.notnull(retail['Customer ID'])]

# 수량, 가격 이상치 제거
retail = retail[retail['Quantity'] >= 1]
retail = retail[retail['Price'] > 0]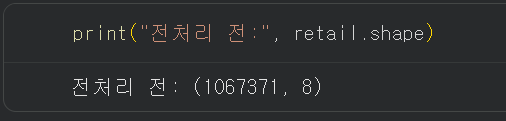

5. 파생변수 만들기 – 총 구매금액
retail['CheckoutPrice'] = retail['Quantity'] * retail['Price']

# 날짜 타입 변환
retail['InvoiceDate'] = pd.to_datetime(retail['InvoiceDate'])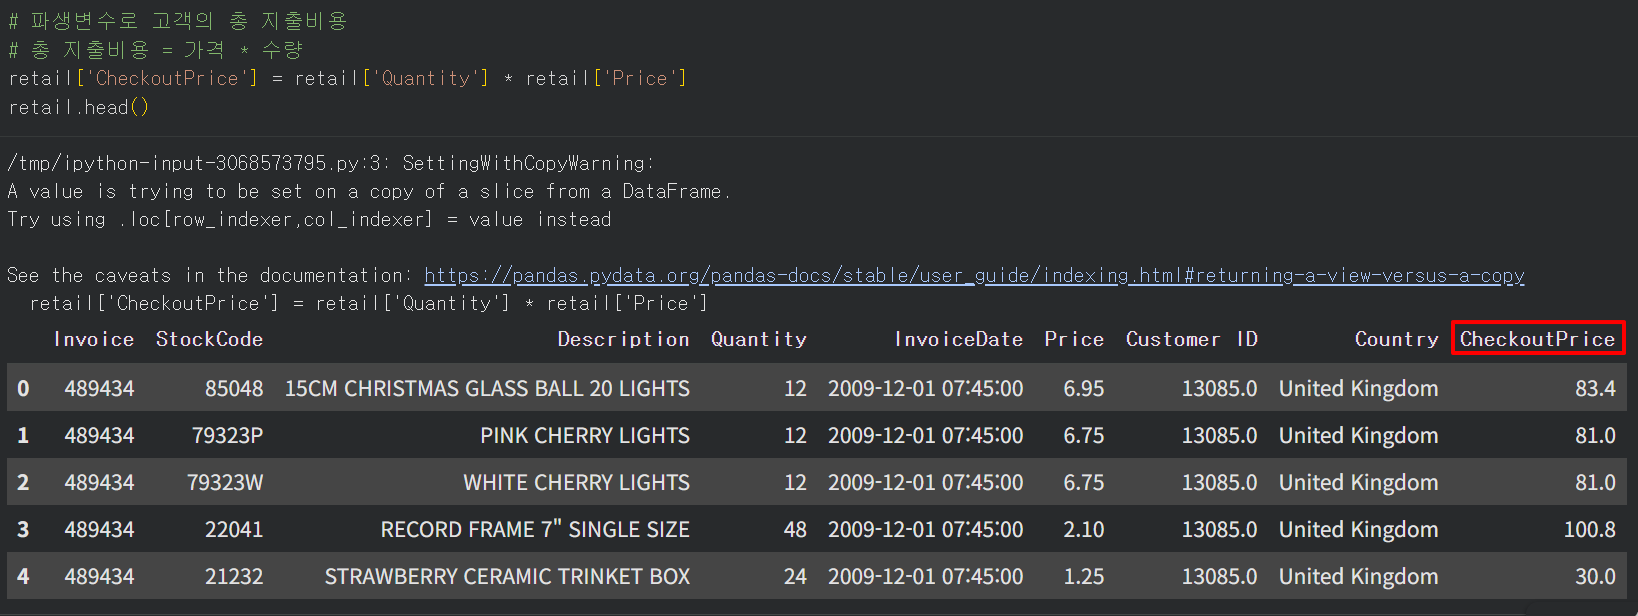
6. 매출 분석 (국가·월·요일·시간대)
# 전체 매출
total_revenue = retail['CheckoutPrice'].sum()
print(f'전체 매출: {total_revenue:,.0f}원')
# 국가별 매출
rev_by_countries = retail.groupby('Country')['CheckoutPrice'].sum().sort_values()
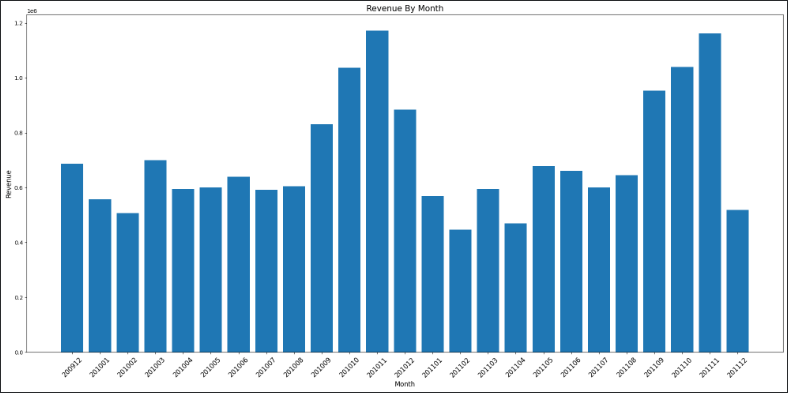
# 월별 매출
def extract_month(date):
return f"{date.year}{date.month:02d}"
rev_by_month = retail.set_index('InvoiceDate').groupby(extract_month)['CheckoutPrice'].sum()
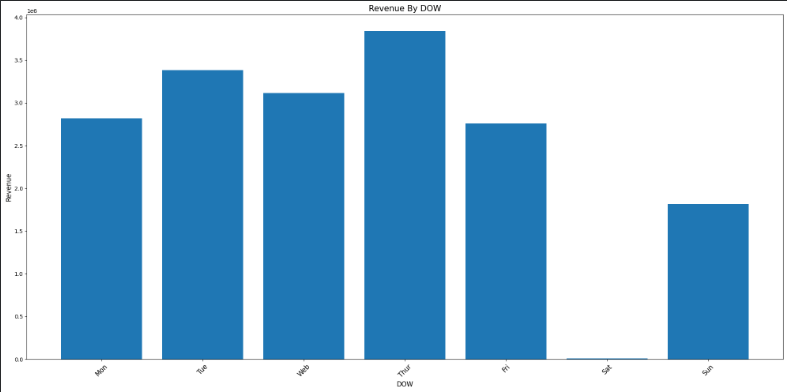
# 요일별 (월=0, 일=6)
rev_by_dow = retail.set_index('InvoiceDate').groupby(lambda d: d.dayofweek)['CheckoutPrice'].sum()
DAY_OF_WEEK = ['Mon', 'Tue', 'Wed', 'Thu', 'Fri', 'Sat', 'Sun']
rev_by_dow.index = DAY_OF_WEEK
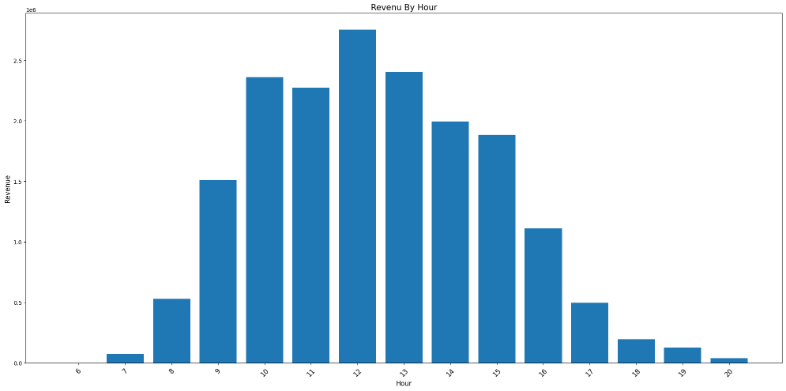
# 시간대별
rev_by_hour = retail.set_index('InvoiceDate').groupby(lambda d: d.hour)['CheckoutPrice'].sum()7. 막대그래프 함수 만들기 (이거 하나로 다 해결!)
def plot_bar(df, title, xlabel, ylabel, figsize=(20,10)):
    plt.figure(figsize=figsize)
    plt.bar(df.index, df.values, color='#89CFF0', alpha=0.8)
    plt.title(title, fontsize=18, pad=20)
    plt.xlabel(xlabel)
    plt.ylabel(ylabel)
    plt.xticks(rotation=45)
    plt.grid(axis='y', alpha=0.3)
    plt.tight_layout()
    plt.show()

# 사용 예시
plot_bar(rev_by_month, '월별 매출', '월', '매출액')
plot_bar(rev_by_dow, '요일별 매출', '요일', '매출액')
plot_bar(rev_by_hour, '시간대별 매출', '시간', '매출액')
한눈에 보는 오늘의 핵심 요약
- 캐글 = 실전 데이터 천국! API 한 번만 설정해두면 편함
- 전처리는 항상 먼저! (결측치·이상치 제거 필수)
- 총 구매금액 파생변수 만들면 분석이 훨씬 쉬워져요
- 그래프 함수 하나 만들어두면 평생 써먹기 가능
'AI활용 멀티모달&MCP 과정' 카테고리의 다른 글
| 소상공인 상가(상권)정보 데이터로 서울 지도 시각화하기 (0) | 2025.11.28 |
|---|---|
| 서울시 공공자전거 실시간 대여소 정보 API 호출 (0) | 2025.11.27 |
| Matplotlib (0) | 2025.11.25 |
| NumPy (0) | 2025.11.22 |
| Numpy & Module (0) | 2025.11.20 |